Kullanıcılar ekstra fırsatlar için Paribahis bonus promosyonlarını takip ediyor.
Her kullanıcı giriş işlemini güvenli şekilde yapmak için Paribahis sayfasına yöneliyor.
Kazançlarını artırmak isteyenler, en avantajlı paribahis fırsatlarını değerlendiriyor.
Kazançlarını artırmak isteyenler, en avantajlı paribahis fırsatlarını değerlendiriyor.
2025’te kullanıcı dostu tasarımıyla Paribahis sürümü geliyor.
Sporseverler için yüksek oranların sunulduğu Paribahis giriş bölümü öne çıkıyor.
Mobil deneyimi ön planda tutan Bettilt giriş uygulaması sektörde fark yaratıyor.
Hızlı ve güvenli erişim için kullanıcılar Bettilt bağlantısını takip ediyor.
Ekstra kazanç arayan bahisçiler Bettilt fırsatlarını asla kaçırmıyor.
Ekstra kazanç arayan bahisçiler Bahsegel fırsatlarını asla kaçırmıyor.
Ekstra kazanç arayan bahisçiler bettilt fırsatlarını asla kaçırmıyor.
Bahis oynamanın keyfini çıkarırken kazanmaya devam edin, Bettilt yanınızda.
Mobil kullanıcılar için en hızlı çözüm Bettilt sürümüdür.
Cep telefonlarından sorunsuz işlem yapmak için Bahsegel sistemi tercih ediliyor.
Anında erişim sağlamak isteyen kullanıcılar bahsegel versiyonunu tercih ediyor.
Bahis sektöründe popülerliğini artıran bettilt kullanıcı dostu arayüzüyle öne çıkıyor.
Bahis dünyasında önemli bir marka olan bettilt her geçen gün büyüyor.
Adres engellerine takılmamak için https://rideitalia.com güncel tutuluyor.
Her cihazla uyumlu çalışan bettilt sürümü pratik bir deneyim sunuyor.
Türkiye’de yaygın olarak kullanılan bettilt güvenilir altyapısıyla fark yaratıyor.
paribahisOyuncular için güvenilirlik ölçütü olarak paribahis giriş sistemleri ön planda.
Bahis keyfini online ortamda yaşamak isteyenler paribahis güncel giriş seçeneklerine yöneliyor.
2025 yılının en çok konuşulacak yeniliklerinden biri Betilt olacak.
Online bahis sektöründe kaliteli hizmetiyle tanınan bahsegel farkını hissettiriyor.
Kullanıcıların gönül rahatlığıyla işlem yapabilmesi için casinomhub politikaları uygulanıyor.
Klasik kumarhane heyecanını evinize getiren paribahis platformda bolca mevcut.
Her kullanıcı için öncelik olan paribahis işlemleri güvence sağlıyor.
Modern altyapısıyla Paribahis kullanıcı deneyimini geliştirmeyi hedefliyor.
Boston Indicators Data Visualization
When I was a Research and Communications Associate at the Boston Foundation, I led the design of our data democratization website, bostonindicators.org. The site uses an open-source data visualization tool known as Weave, which allows user to complete their own visual data analyses and embed interactive graphics.
The Boston Indicators Project offers new ways to understand Boston and its neighborhoods in a regional, national and global context. It aims to provide access to information, foster informed public discourse, track progress on shared civic goals, and report on change in 10 sectors: Civic Vitality, Cultural Life and the Arts, the Economy, Education, the Environment, Health, Housing, Public Safety, Technology, and Transportation.
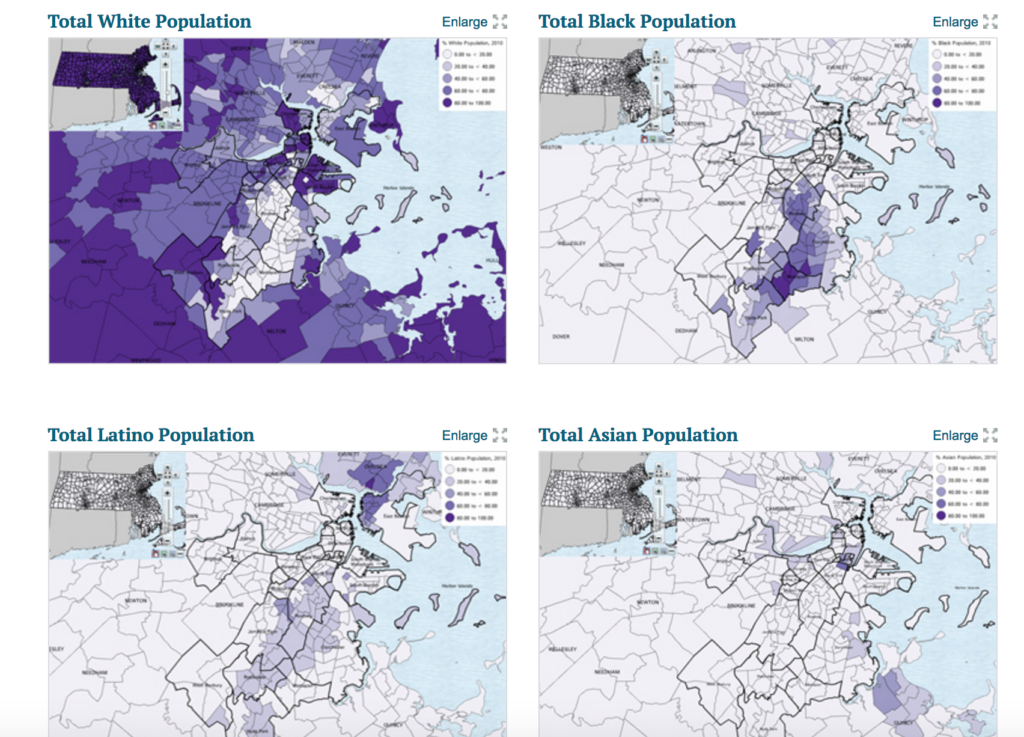
The visualization to the right shows racial/ethnic diversity by census tract in Boston. The visualization at the bottom shows the locations of arts facilities with respect to child population in the city.
